Six views.
One operating picture.
Explore a fictional contractor’s cash, receivables, sales and job performance. Each view explains its figures and the decision they support.
Product in development · Sample data throughout · Availability details →
What needs attention today?
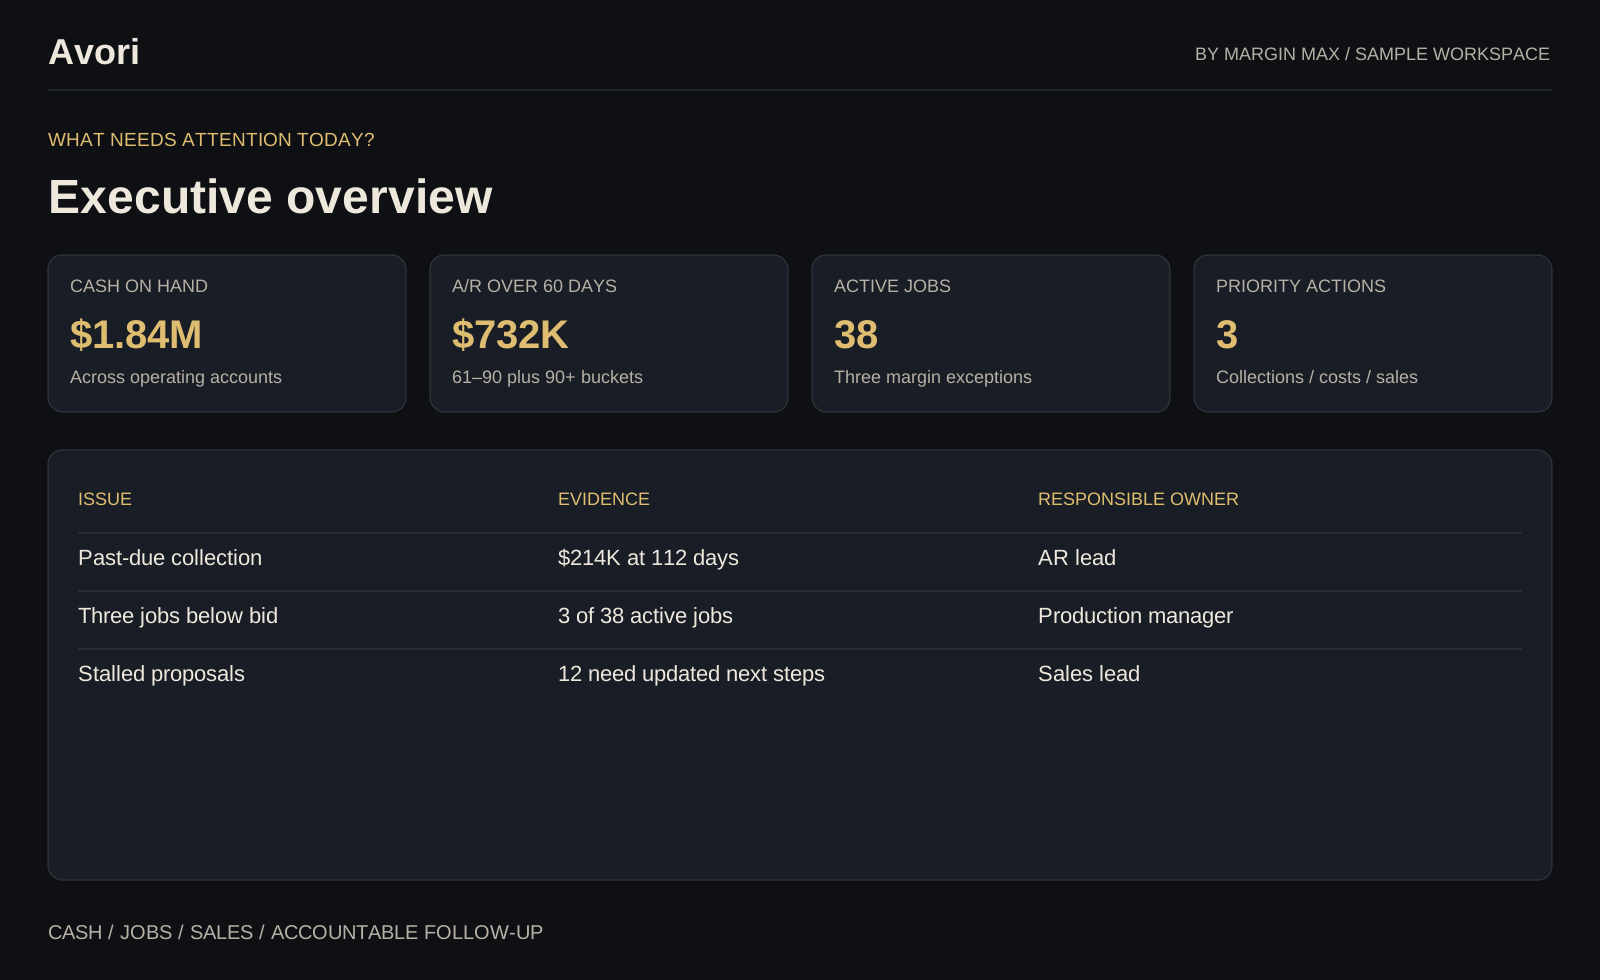
| Issue | Evidence | Responsible owner |
|---|---|---|
| Past-due collection | $214K at 112 days | AR lead |
| Three jobs below bid | 3 of 38 active jobs | Production manager |
| Stalled proposals | 12 need updated next steps | Sales lead |
Start with the largest overdue balance, then review the margin exceptions and stalled sales. Each issue has a named owner and a supporting record.
When does the forecast get tight?
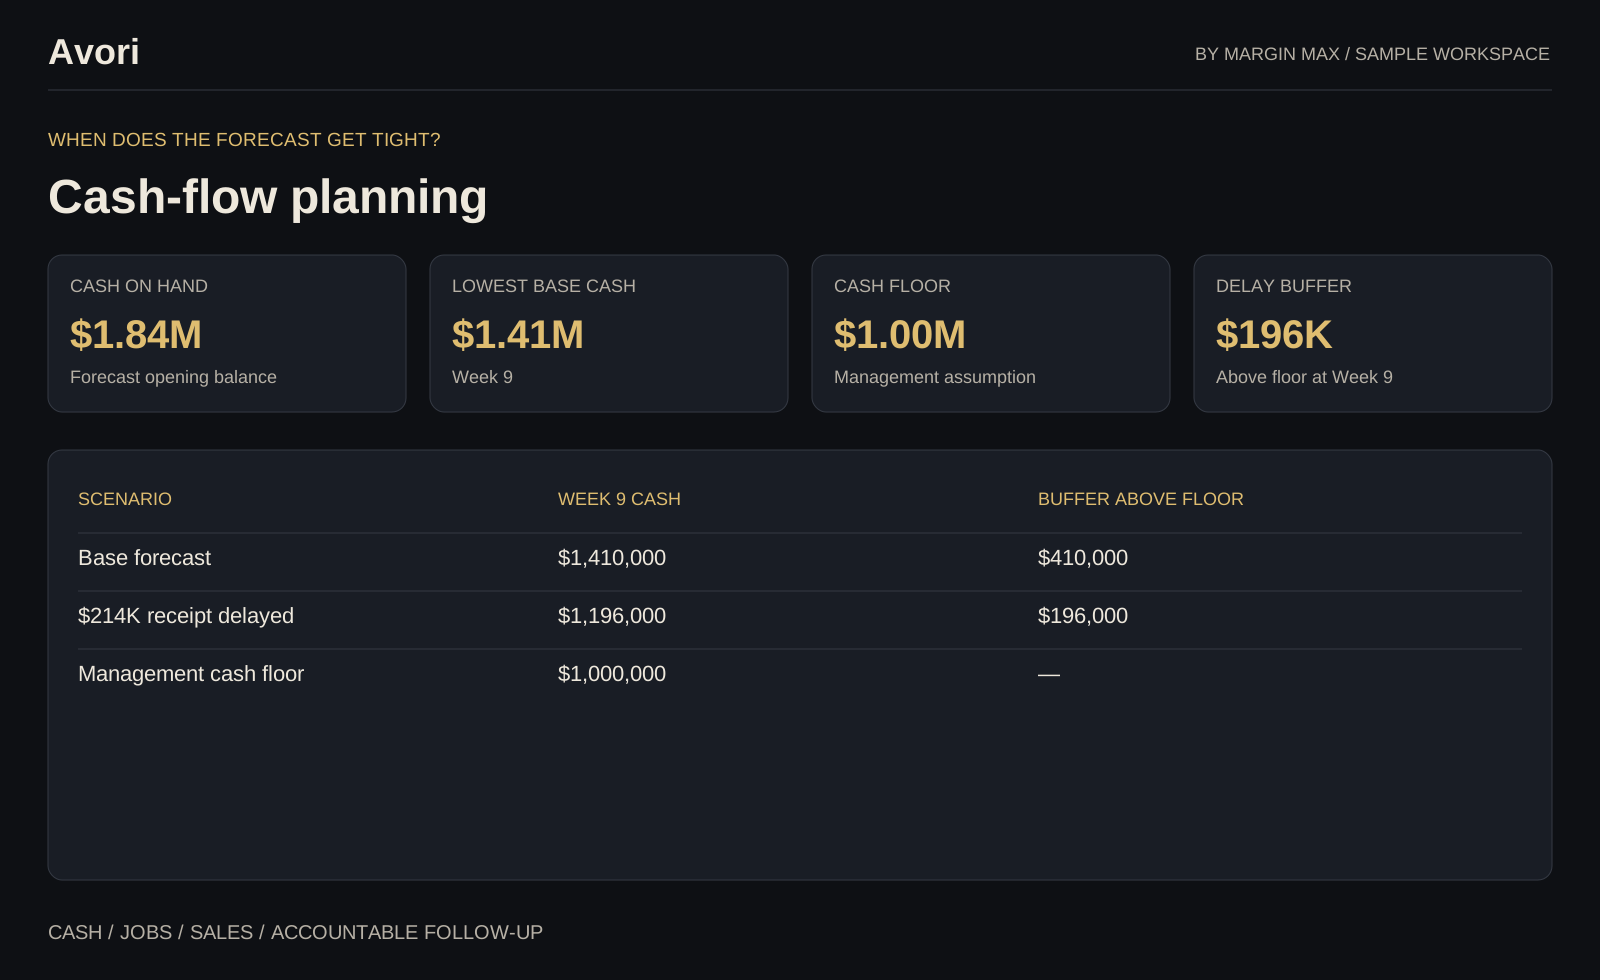
| Scenario | Week 9 cash | Buffer above floor |
|---|---|---|
| Base forecast | $1,410,000 | $410,000 |
| $214K receipt delayed | $1,196,000 | $196,000 |
| Management cash floor | $1,000,000 | — |
The scenario moves a $214,000 collection beyond Week 9: $1,410,000 − $214,000 = $1,196,000. The remaining buffer above the $1,000,000 floor is $196,000.
Who owes us, and who follows up?
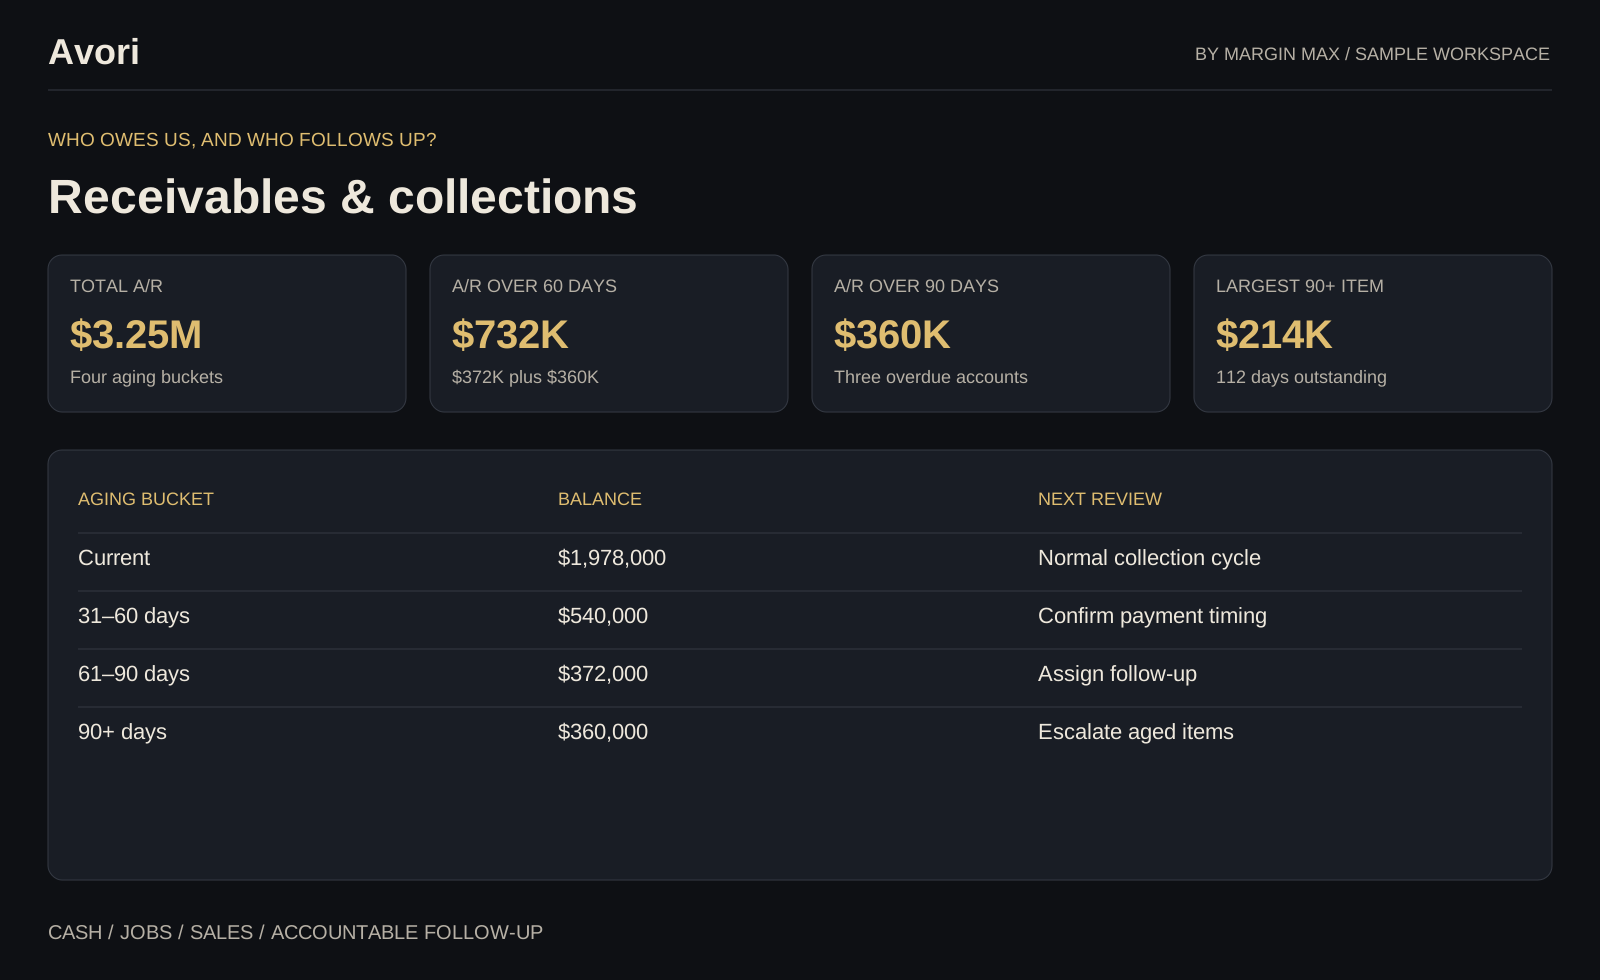
| Aging bucket | Balance | Next review |
|---|---|---|
| Current | $1,978,000 | Normal collection cycle |
| 31–60 days | $540,000 | Confirm payment timing |
| 61–90 days | $372,000 | Assign follow-up |
| 90+ days | $360,000 | Escalate aged items |
The four buckets total $3,250,000. The three 90-plus-day accounts are $214,000 at 112 days, $100,000 at 94 days and $46,000 at 91 days; together they total $360,000.
Which opportunities need a next step?
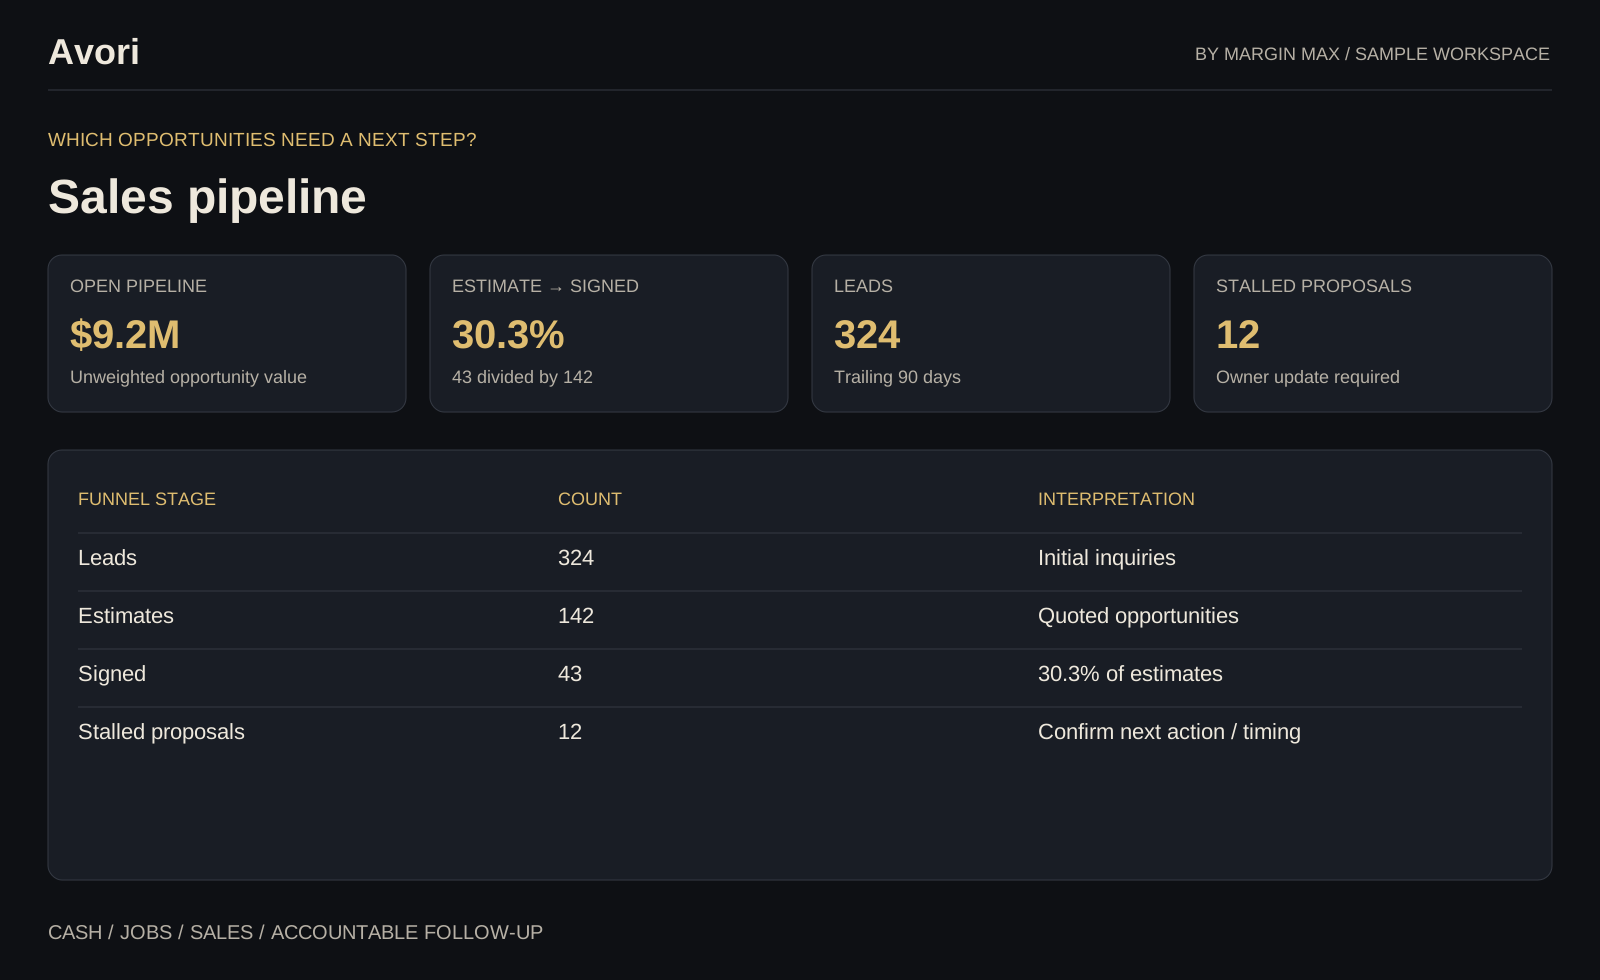
| Funnel stage | Count | Interpretation |
|---|---|---|
| Leads | 324 | Initial inquiries |
| Estimates | 142 | Quoted opportunities |
| Signed | 43 | 30.3% of estimates |
| Stalled proposals | 12 | Confirm next action / timing |
Track potential sales separately from invoiced revenue and cash. The estimate-to-signed conversion rate is 43 ÷ 142 = 30.3%.
Which projects need a cost review?
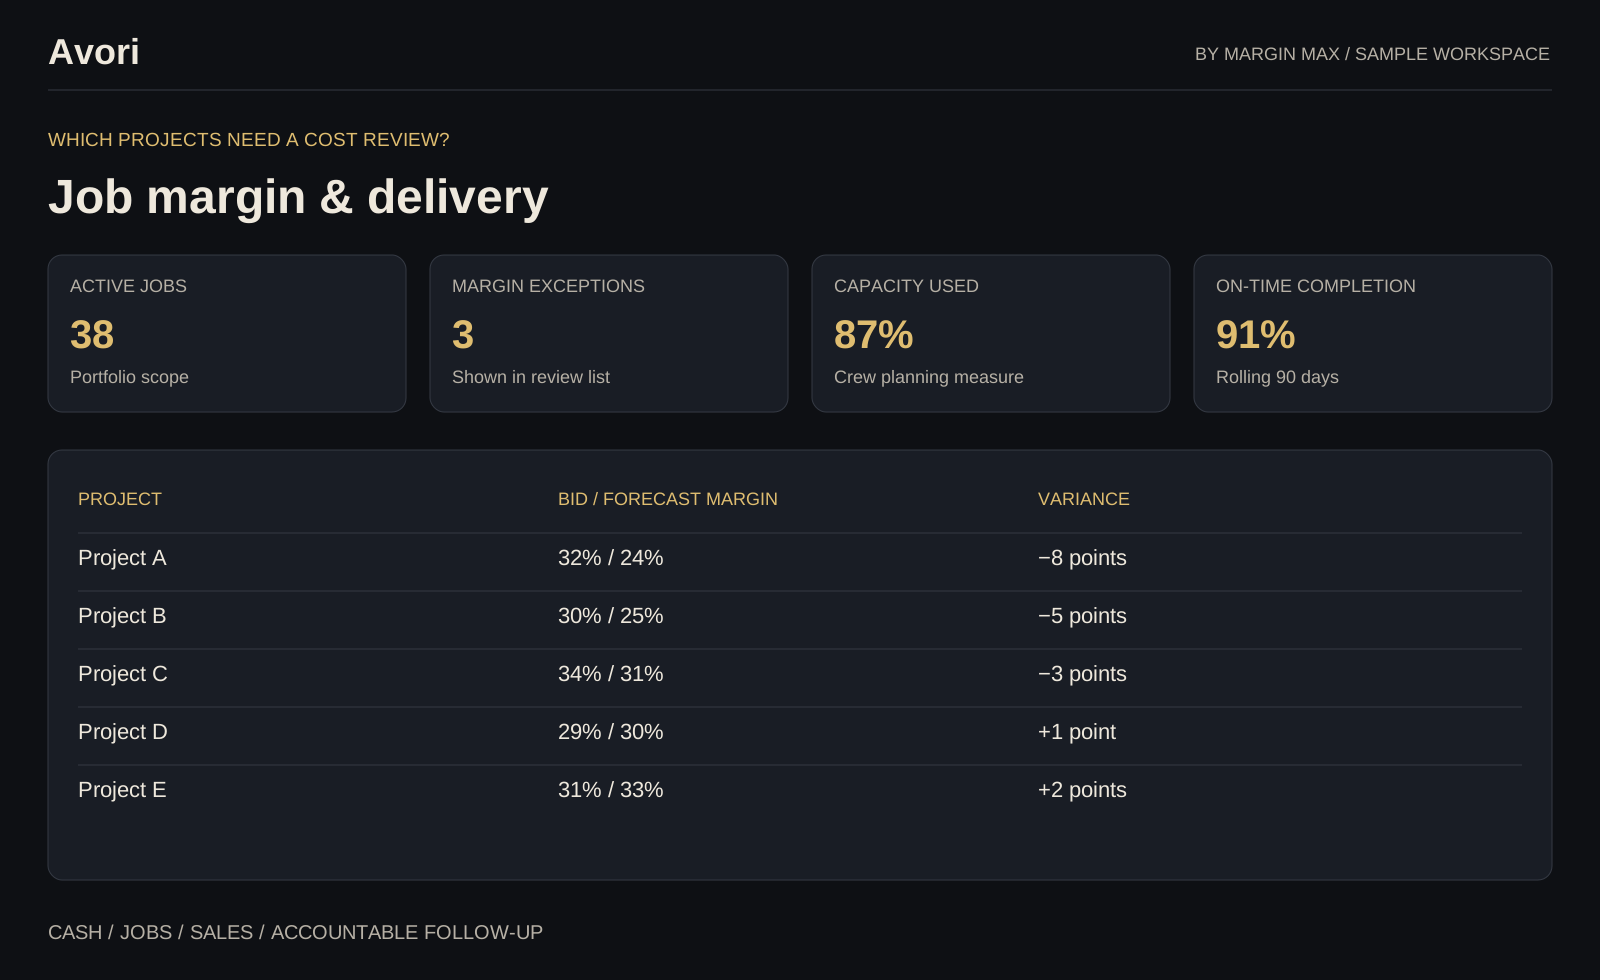
| Project | Bid / forecast margin | Variance |
|---|---|---|
| Project A | 32% / 24% | −8 points |
| Project B | 30% / 25% | −5 points |
| Project C | 34% / 31% | −3 points |
| Project D | 29% / 30% | +1 point |
| Project E | 31% / 33% | +2 points |
Three of the five displayed projects are below bid margin. Review remaining costs, approved changes and billing with project owners before deciding the corrective action.
Who owns the operating response?
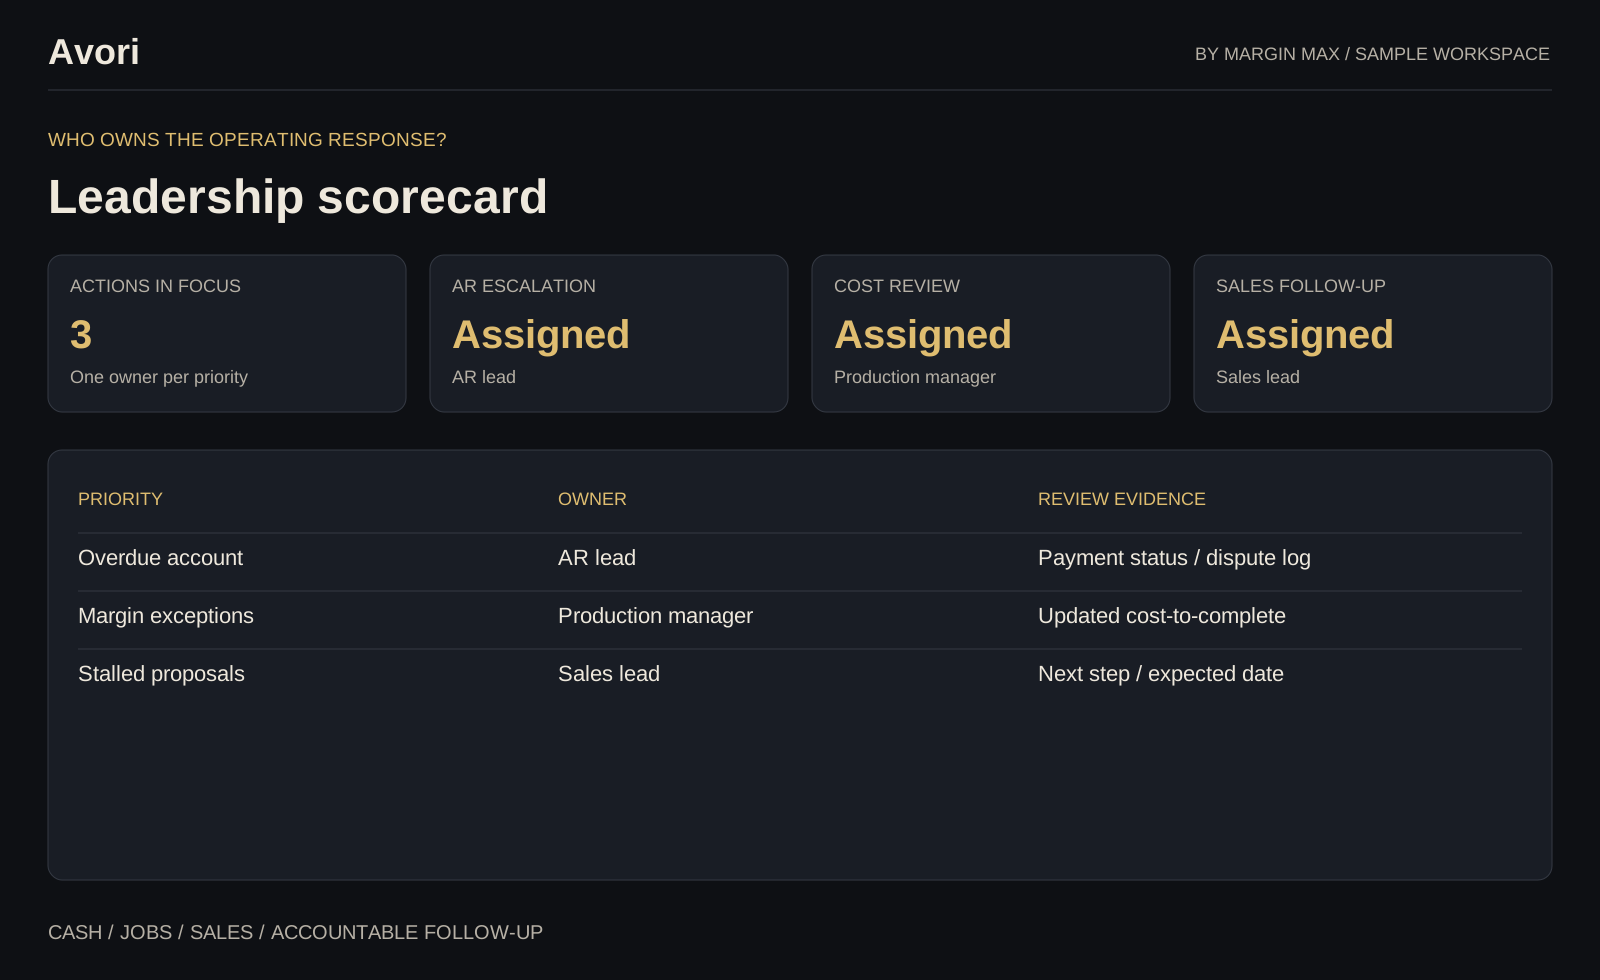
| Priority | Owner | Review evidence |
|---|---|---|
| Overdue account | AR lead | Payment status / dispute log |
| Margin exceptions | Production manager | Updated cost-to-complete |
| Stalled proposals | Sales lead | Next step / expected date |
Each operating priority has a named owner, supporting evidence and a clear item to bring to the review.